Each year the Waste Authority publishes data about waste and recycling activities in Western Australia. The waste and recycling data is primarily collected from annual returns lodged by liable persons to the Department of Water and Environmental Regulation under the Waste Avoidance and Resource Recovery Regulations 2008 (WARR Regulations), and through quarterly waste levy returns.
Only solid waste is required to be reported under the WARR Regulations. Most mining, agricultural and forestry wastes are excluded.
The data is used to measure progress towards the targets in the waste strategy, meet national reporting requirements and inform policy development and decision-making about waste avoidance and resource recovery in Western Australia.
Waste generated
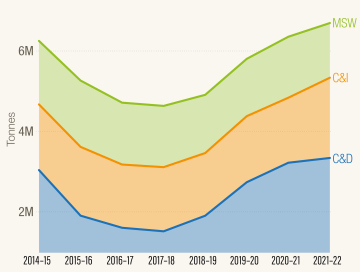
- 6.7 million tonnes was generated, with 4.2 million tonnes recovered (62 per cent) and 2.5 million tonnes disposed of to landfill.
- 50 per cent of all waste generated came from the construction and demolition (C&D) stream, 30 per cent from the commercial and industrial (C&I) stream and 20 per cent from the municipal solid waste (MSW) stream.
- 77 per cent of all waste generated came from the Perth and Peel regions, with 23 per cent from other regions across Western Australia.
Waste recovery
- The overall material recovery rate increased to 62 per cent in 2021–22, from 60 per cent in 2020–21.
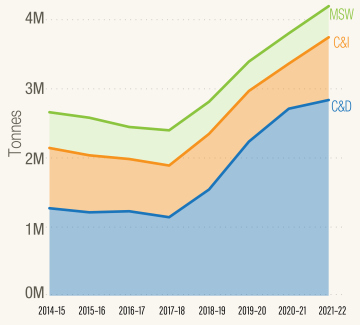
- A total of 4.2 million tonnes of waste was recovered in 2021–22, which is an increase of 10 per cent from the previous year.
- 67 per cent of all recovered materials were C&D category materials.
- 77 per cent of materials recovered were reprocessed in Western Australia ‒ mostly C&D and organic waste.
Domestic waste collected by local governments
- Local governments collected 1.49 million tonnes of domestic waste from their residents and reported a 34 per cent material recovery rate.
- Overall, material recovery was higher in the Perth and Peel regions (37 per cent) compared with other regions in the state (26 per cent).
- Local governments collected 981,000 tonnes of domestic waste through kerbside services.
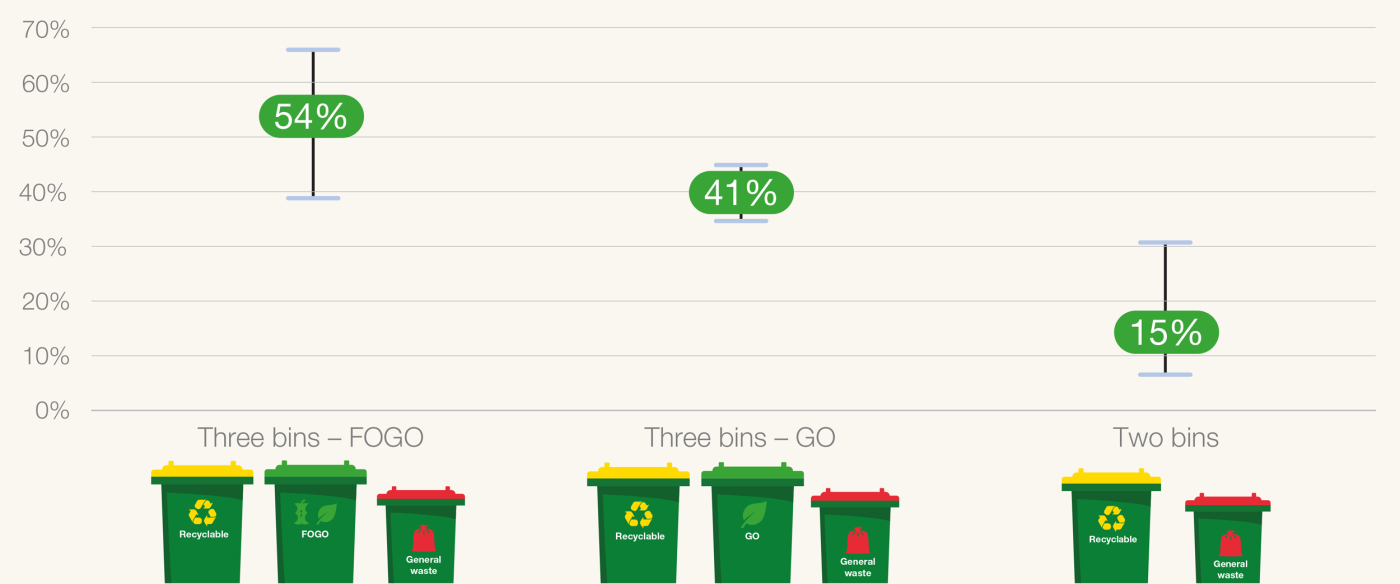
- 98 per cent of the population had at least one kerbside waste service, and 94 per cent were provided with a comingled recycling service (yellow‑lid bin). Fifteen per cent of the population were provided with a food organics and garden organics (FOGO) bin and 30 per cent with a garden organics (GO) bin.
- The best performing kerbside system for material recovery was the three‑bin FOGO system. Three‑bin FOGO systems had an average recovery rate of 54 per cent, compared with only 15 per cent for two‑bin systems.
Performance against waste strategy targets
| Waste stream | 2014–15 | 2021–22 | Targets 2025 | 2030 |
|---|---|---|---|
| Recovery targets (%) | |||
| Overall | 42 | 62 | 70% | 75% |
| MSW (Perth & Peel) | 39 | 36 | 67% | 70% |
| C&I | 53 | 45 | 75% | 80% |
| C&D | 42 | 85 | 77% | 80% |
| Avoid targets (kilograms per capita) | |||
| Overall | 2,452 | 2,415 (-2%) | 10% reduction | 20% reduction |
| MSW | 621 | 492 (-21%) | 5% reduction | 10% reduction |
| C&I | 642 | 722 (+12%) | 5% reduction | 10% reduction |
| C&D | 1,188 | 1,201 (+1%) | 15% reduction | 30% reduction |
| Protect targets (% disposal to landfill) | |||
| Overall (Perth and Peel) | 49% | 31% | 2030 target <15% |